Redistribution supply chain network (RSCN) – modelling and optimization

One of our teams field of specialization is the use of artificial intelligence for modeling and optimizing complex transport models. From the practical point of view, the optimal planning of transport resources and supervision of their implementation is one of the key tasks in the area of supply chain management. In this type of solutions, using artificial intelligence and advanced computing IT systems can bring observable benefits. One of the solutions this post refers to is the optimization of redistribution network of the supply chain (RCSN).

Pros, cons and uses
 RCSN is an alternative to the centralized distribution networks (CDN) that consist of one central warehouse for the storage and distribution of goods. CDN is effective if we carry out large, repetitive orders to destinations that are close to each other. If our supply chain get’s more complicated we can add some a number of local warehouses to place the goods closer to final destination. While the CDN generally simplifies transport management, it does not allow to optimally distribute costs of supply for complicated logistic models. Though the RCSN is more complex and more expensive to manage compared to the classic versions of warehousing, with the support of a specified IT solutions it guarantees a stable level of services, maintaining the performance of order management and distribution.

Use case

In this article, we will show how Inero Software team deals with the above-mentioned problems in an example use case. Let’s assume that we have a company with many branches and we need to exchange the necessary materials between them for proper functioning. To optimize costs and efficiency, we don’t always need to complete another large order from the supplier, but we exchange materials between nearby branches. It is a much better and faster solution, and one of the most important aspects is that it minimizes the workload.
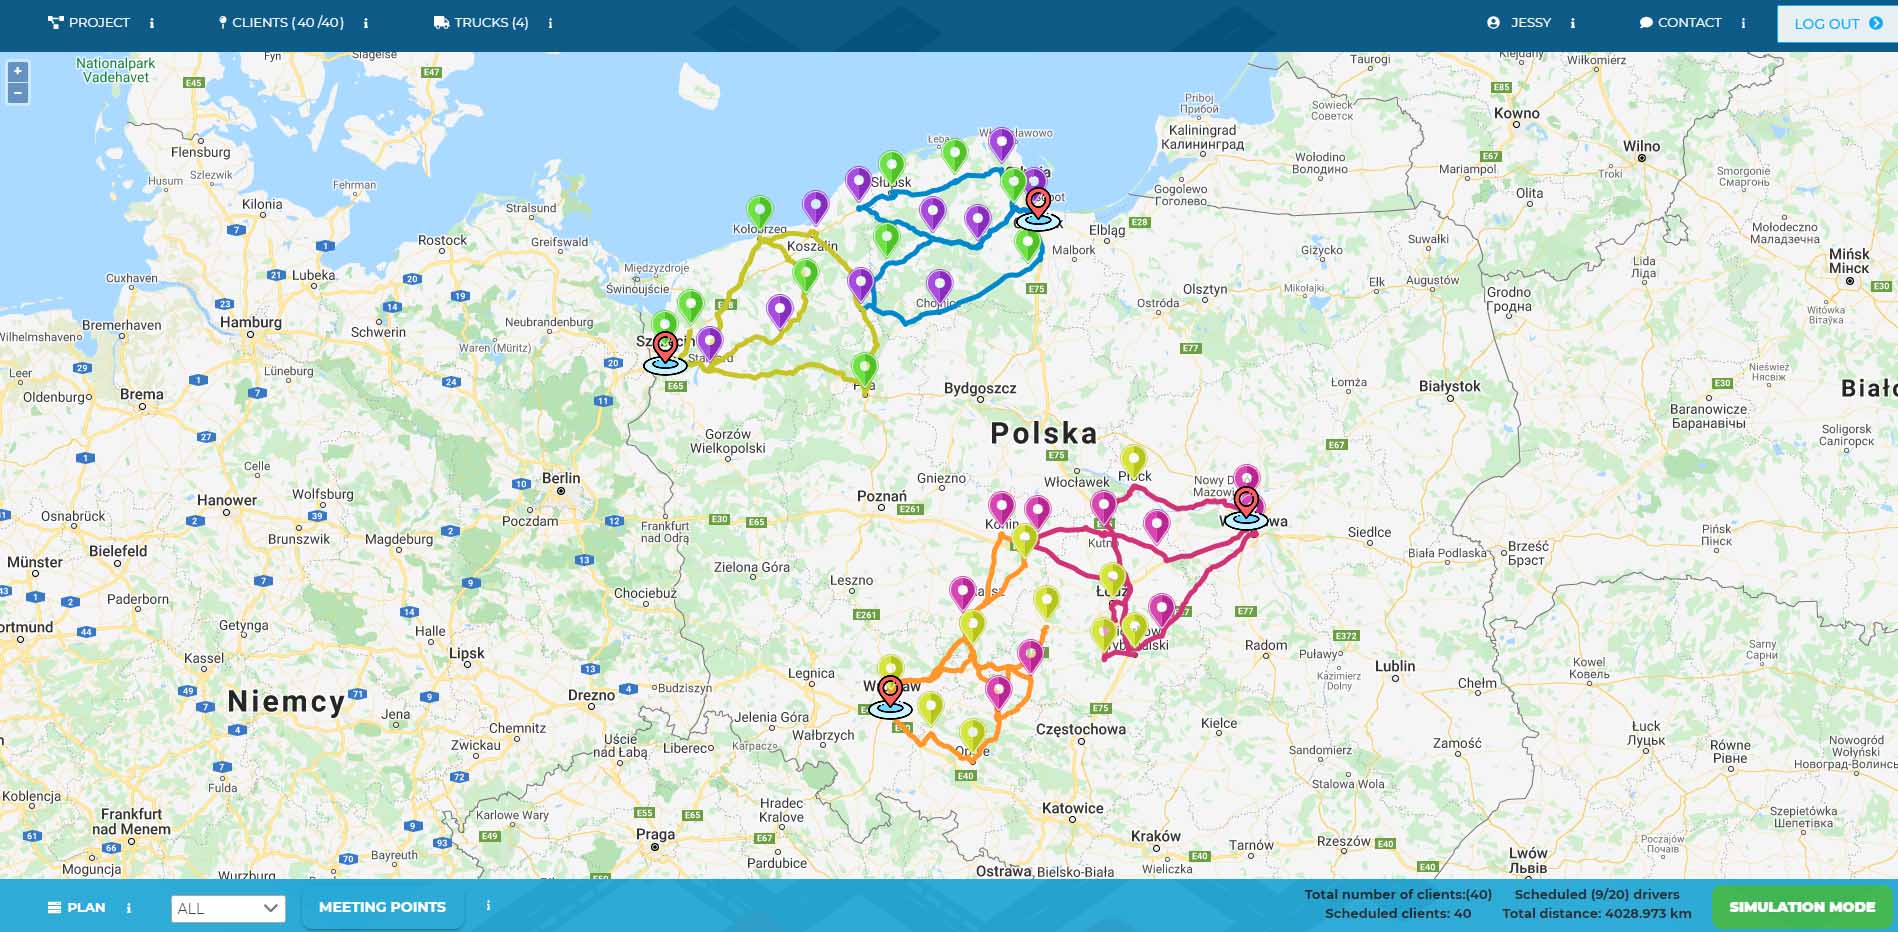
Let us assume, that in our showcase , we have 4 drivers and 40 company branches between, where each branch belongs to 1 of 4 groups( indicated by pin color in figure below). In the given use case, it was assumed that the goods may be stored and exchanged only between locations from the same group (a pin of the same color on the map), but the transport flow must be maximized between all locations. In order to optimize the total supply chain, it was assumed that the closest locations in a given group are the warehouses in the vincity of the particular driver’s home-base. This means that before the commodities are exchanged between individual points, the driver must pick up the goods from the defined warehouse and store them at the end of the daily route.
In addition, when generating routes by the system, optimization algorithms takes under consideration following constraints:
- each driver starts and finishes his/hers route at the warehouse. This means that the driver cannot leave any goods in the car for the night before/after the route;
- goods are intended to be transferred among one group and cannot not be stored in the local warehouse (destination) of other groups. However, commodities dedicated for different groups, can be transported by the same vehicle;
- every destination (location) can be considered as a local warehouse;
- the driver cannot exceed the driving time and daily mileage limit;
Moreover, some other specific limitations can be defined in the system, e.g. that the driver can only move in a restricted area, maximum 9 hours a day, can be defined. In this context the goal of the optimization is to maximize cargo flow between different branches of the company.
The picture below shows an example of the result optimization of redistributing goods using our solutions.

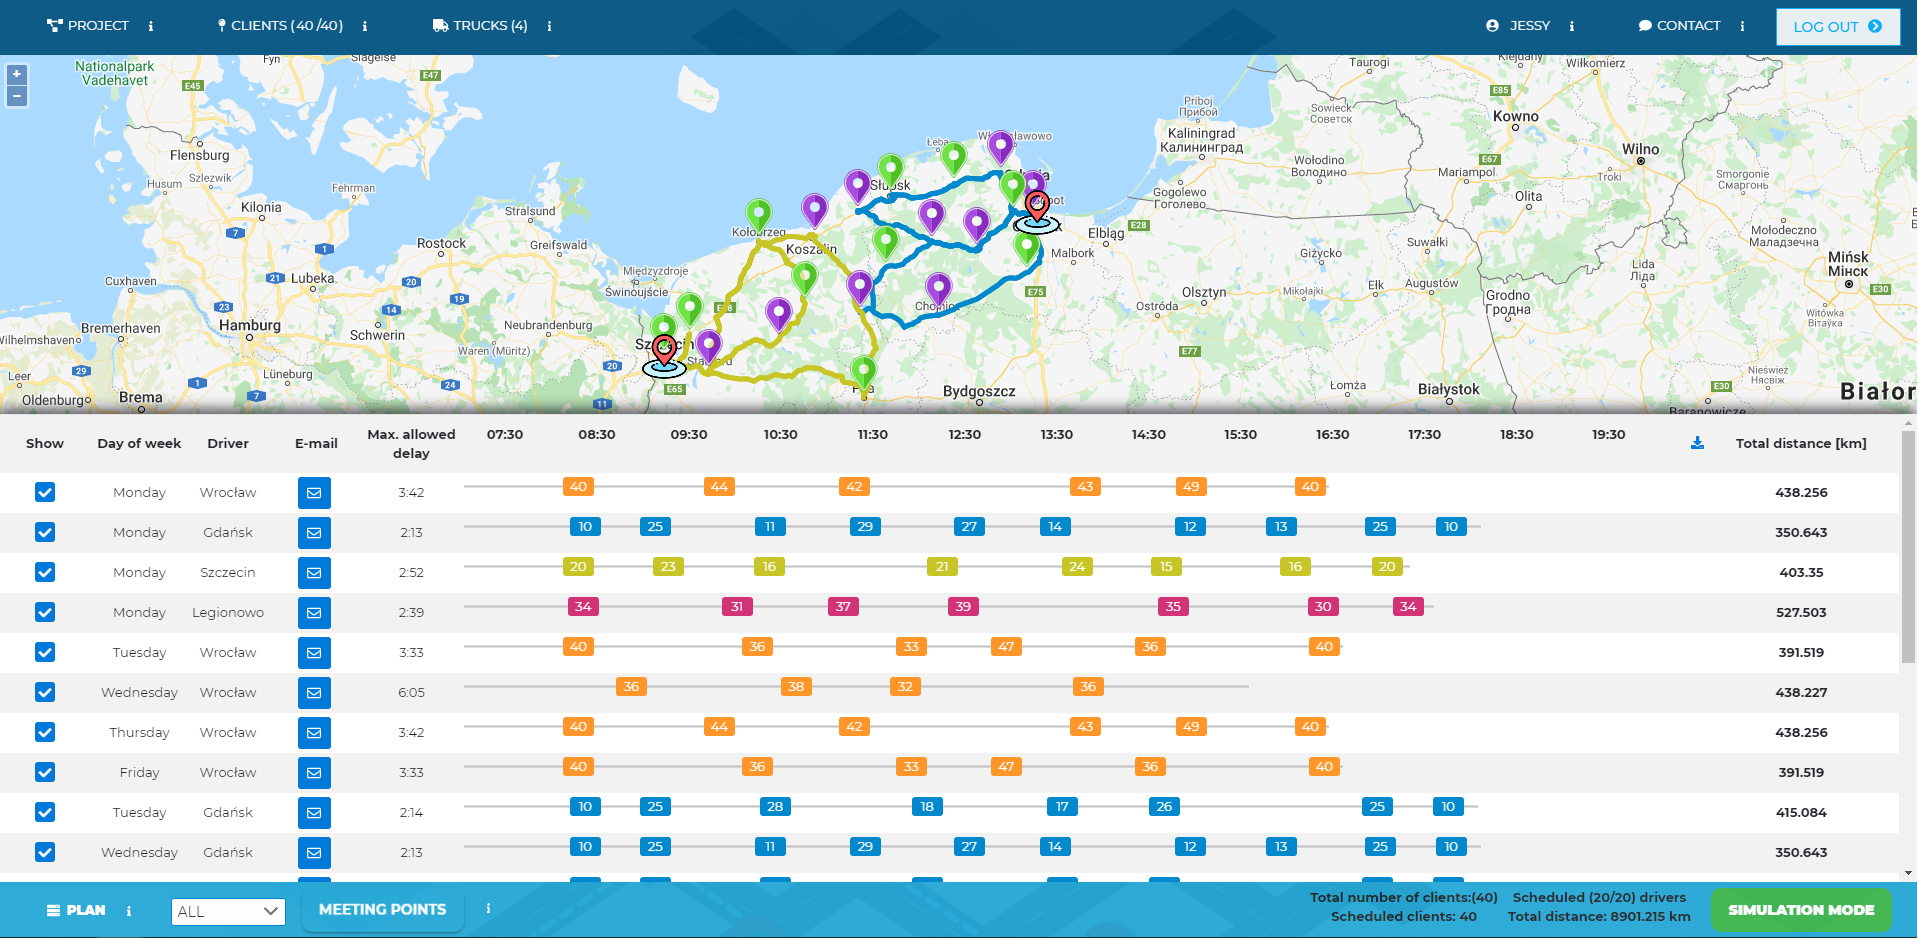
As you can see in the picture above, the system has generated a driving plan for each driver for each day of the week. Thanks to this, we can ensure the exchange of the necessary goods in a given area, even several times a week.
As part of defining individual locations of the local warehouses, each of them was given a unique id in the range 10-49. The illustration below shows the generated driver’s work plan divided into individual days.

It can be seen that the simulation requirements were met. If we visit a certain group on a given day, we initially pick up the goods and finally store them in the same unit belonging to the same group.
If the problem would require the exchange of goods between larger areas, e.g. from the western part of Poland to the northern part, etc., the implemented software could be extended with drivers’ meeting points and the exchange. Then, the cargo can be delivered depending on the demand to specific branches of the company. This process is based on the previously generated solution. The system’s algorithms determine which locations have been selected for drivers’ routes. On this basis, the route-based, the system finds the closest point on the map where drivers can potentially meet. If there are such places, they are added at certain times, (e.g. 12pm to 1pm, Monday) to the driver’s schedule. In the next stages, the system intelligently selects the remaining locations, maintaining continuity and increasing the area of exchange.


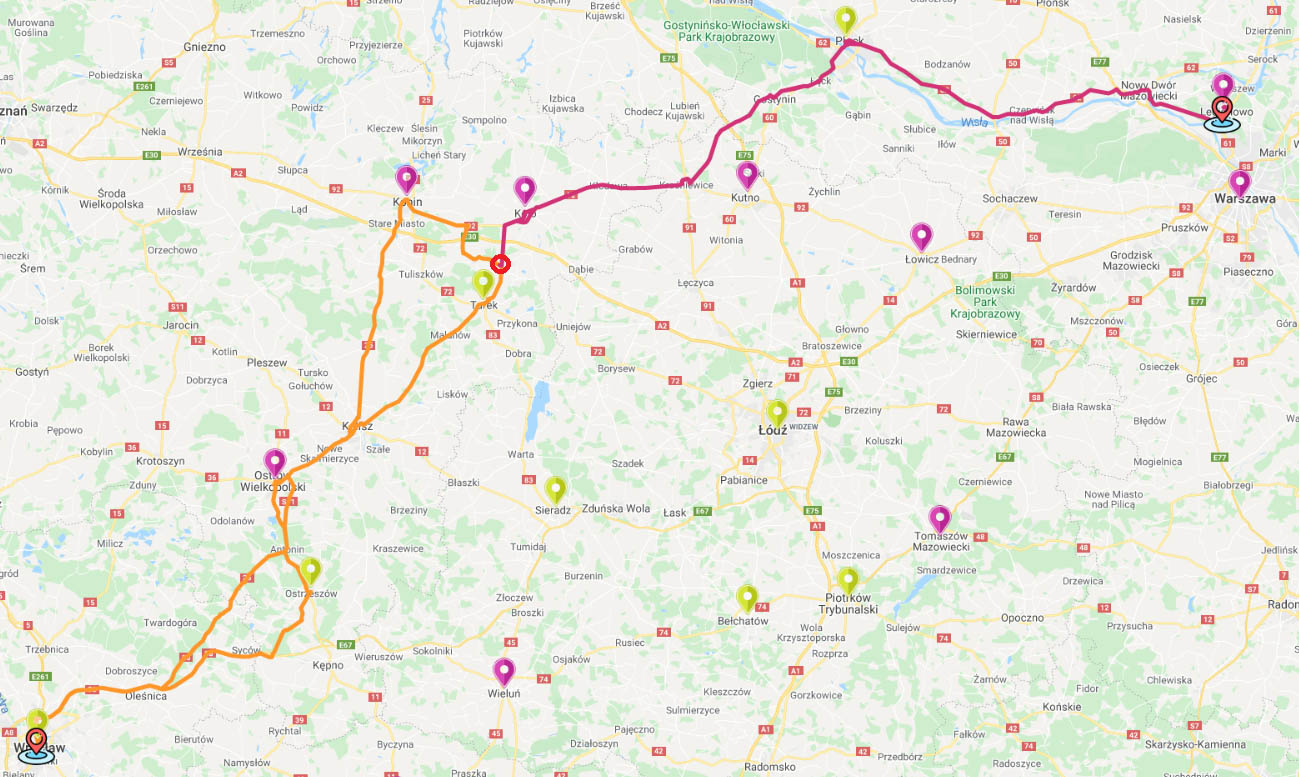
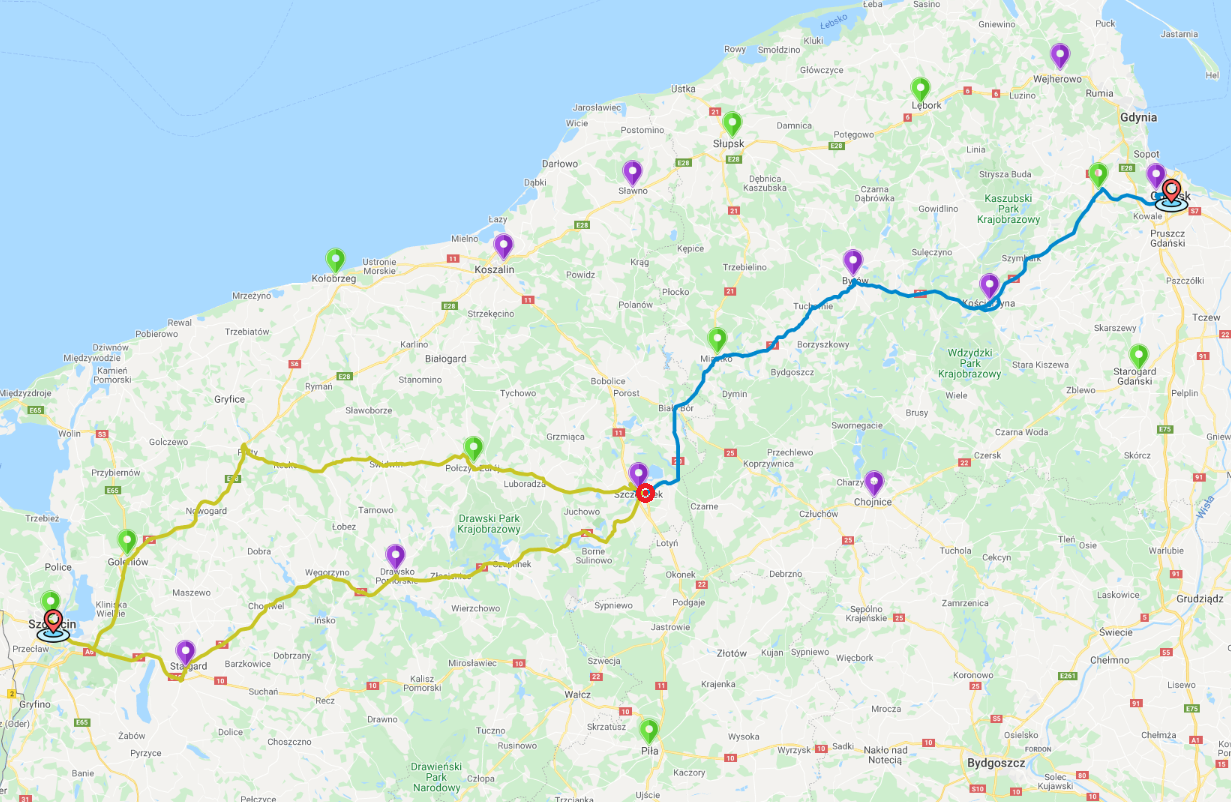
The figure below shows the location of meeting points on the Monday route for drivers’ routes (Szczecin – Gdańsk) and (Wrocław – Legionowo).
Cargo swap points have been given a unique id to include them along the route.
- (Szczecin – Gdańsk) – 100,
- (Legionowo – Wrocław) – 101.

As you can see, meetings are held at designated times. Thanks to this operation, we exchange goods between larger areas, and in the next days we can distribute it to other locations.

Solution

In our solutions, we use methods and techniques of artificial intelligence to model the problem of redistribution of goods and then optimize the commodities flow in distributed network. In situations where a large amount of calculations is required, various heuristic methods come to the rescue. They allow to minimize calculation costs and speeding up finding the optimal solution. Heuristic searches are suitable for complex problems. The artificial intelligence estimates quality of available solutions, and every iteration improves output result. In the case of a logistic redistribution network, every step of the optimization, extends the resulting node (i.e. in our case the route) with the node with the lowest value of the predefined evaluation function.
In our solutions, for example, we use the greedy algorithm. The model at each step makes the optimal choice at the moment, based on the given evaluation function. In the case of transport problems, it will certainly be the number of kilometres imposed converted into costs compared to the current fuel price. The algorithm, by adding new customers along the route, makes the optimal decision, i.e. the cheapest one at the moment.
The simplest form of the evaluation function can be defined as:
cost = new_distance - current_distance
where:
new_distance – total distance to the new point from the driver’s location,
current_distance – current distance, from the driver’s location to the actually last point.

Summary
The use of IT systems supporting the supply chain redistribution network definitely allows for an optimized flow of goods. In addition, it can provide many additional analytical tools, such as:
- order and invoice reports,
- archiving statistics,
- delivery time information system,
and many others tailored to customer needs…


