

Region based Convolutional Neural Network – R- CNN

Thanks to the development of computing technology and artificial intelligence in recent years, applications using machine learning and systems based on neural networks have more and more business uses. Moreover, the advancement of technology has made machine learning, adapting advanced solutions based on neural networks cheaper and allows for relatively quick creation of solutions that have direct application, such as tracking objects on the camera image (tracking cars in parking lots, detecting people on construction sites) or extracting information from scans of documents (finding amounts and contractor data on an invoice).
In the described material, we presented the methodology that we use as part of our ML-based work using R-CNN networks, which due to the universality of the structure and architecture of the model, work well in a wide range of areas. It is a type of neural network specifically designed to detect objects, which at least one layer is a convolution layer, allowing to distinguish the features of the manipulated image. Based on the input image, R-CNN determines potential ROI’s (regions of interest) by selective search segmentation. Then each of them is analyzed by a neural network to obtain the probability of the object classification.
R-CNN detectors are widely used in:
- driver assistance systems in autonomous cars,
- face recognition,
- anomalies detection,
- health risk assessment and biomarkers of aging discovery,
- Intelligent multi-site surveillance system,
and many others…
Building your own R-CNN detector is a simple task that does not require a lot of work. In this article you will see an example of its use and the next steps in the process.

Use case
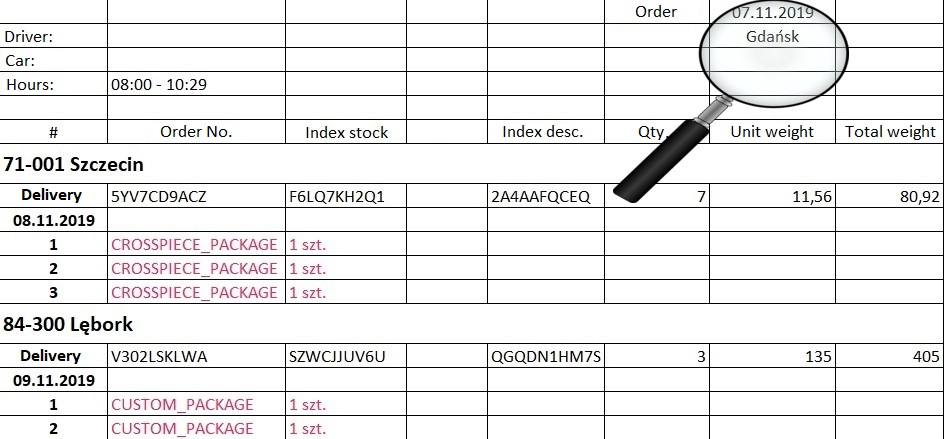
In order to demonstrate the possibility of building Your own detector based on R-CNN, the use case in this article will be the date detection on the transport document. Your solution may have different elements or the number of classes of objects to be recognized. A sample document is shown in the illustration below. As You can see, there are many irrelevant elements on this picture. In this case, we are only interested on each date.
Software architecture
Programming tools enabling the implementation of the system in Python are, for example:
- Tensorflow,
- Keras,
- OpenCV,
- Scikit-learn.
Once we have configured development environment, the first step in building the system is collecting the dataset. In order to make a R-CNN based detector with a high measure of accuracy, remember that:
- the collection of images must be extensive and diverse,
- as input to the model must be of the same dimension,
- eliminate duplicates that can cause network over-matching.
For a good start, in the described case of the article it is enough to prepare even a few photos of the elements that we want to recognize, preferably against the background of other objects. Why such preferences? In the next step of the algorithm, should be a positive and negative samples generated from the prepared set.
In order to generate the samples, we will use selective search segmentation. The possibility of using this algorithm is provided by the OpenCV library. This function uses hierarchical clustering to group pixels and then combine them into one based on color, texture or composition. The following is an implementation of the search code on the base image. The output of the process is a set of a potential ROI’s, depending on the size of the photo, even over 2.000 item’s.
selective_search = cv2.ximgproc.segmentation.createSelectiveSearchSegmentation()
selective_search.setBaseImage(image)
selective_search.switchToSelectiveSearchFast()
rects = selective_search.process()
To divide the generated ROI’s, for example, we can use a metric called IoU (Intersection over Union). It’s defined as the intersection area divided by area of the union of a predicted bounding box and ground-truth box. Using this factor will allow You to filter when building a sample set. However, before we proceed to this operation, You should manually prepare the ground truth. There are many different object tagging programs available on the internet. In this article, we will use the VoTT (Visual object Tagging Tool) originally developed by the Commercial Software Engineering (CSE) group at Microsoft.
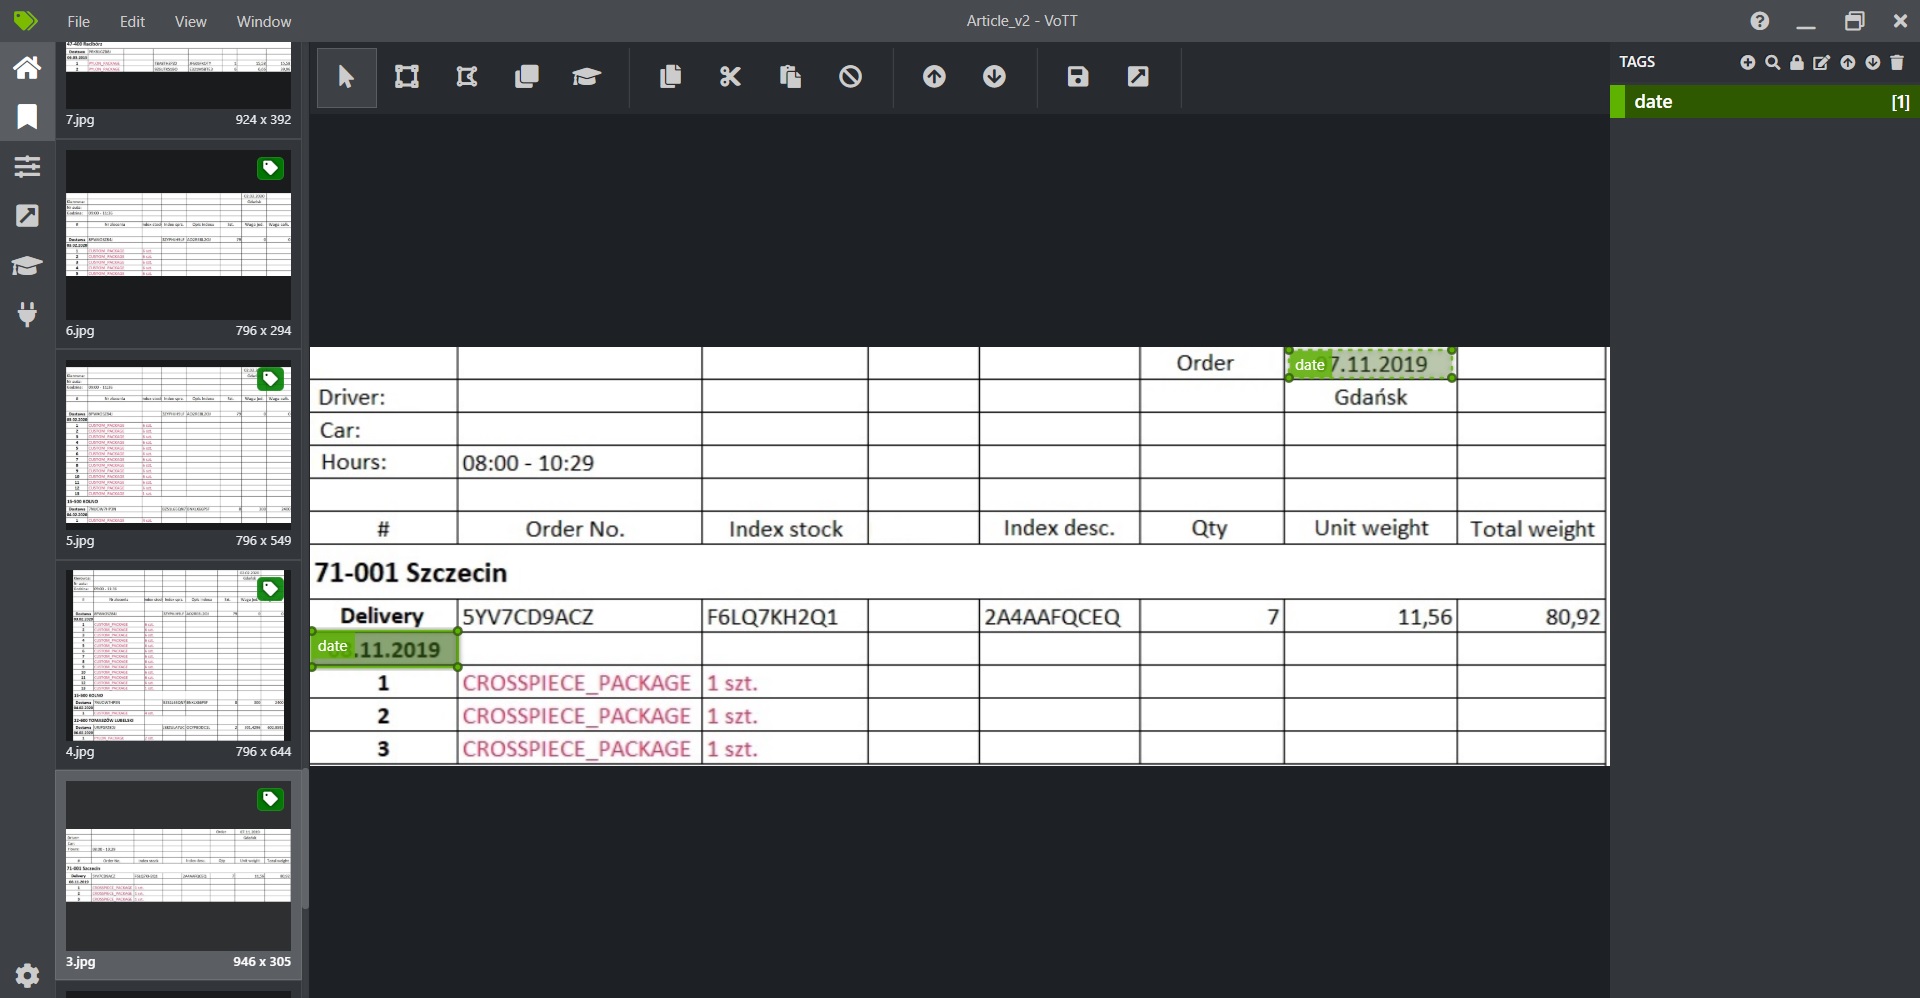
The above image shows the tagged date in the sample photo. The operation should be repeated for all prepared data and exported to the appropriate format (JSON, XML, etc.). The generated files contain the exact coordinates and labels of previously marked objects. This allows us to compare our tagged data with those that will return a selective search segmentation. In this algorithm, we decided to set the IOU to 0.5, because of the good prediction result. You can modify this ratio depending on Your preferences and check whether the resulting data set is consistent with the assumptions. After executing the script, the filtered data should look like this (on the left – positives, on the right – negatives).
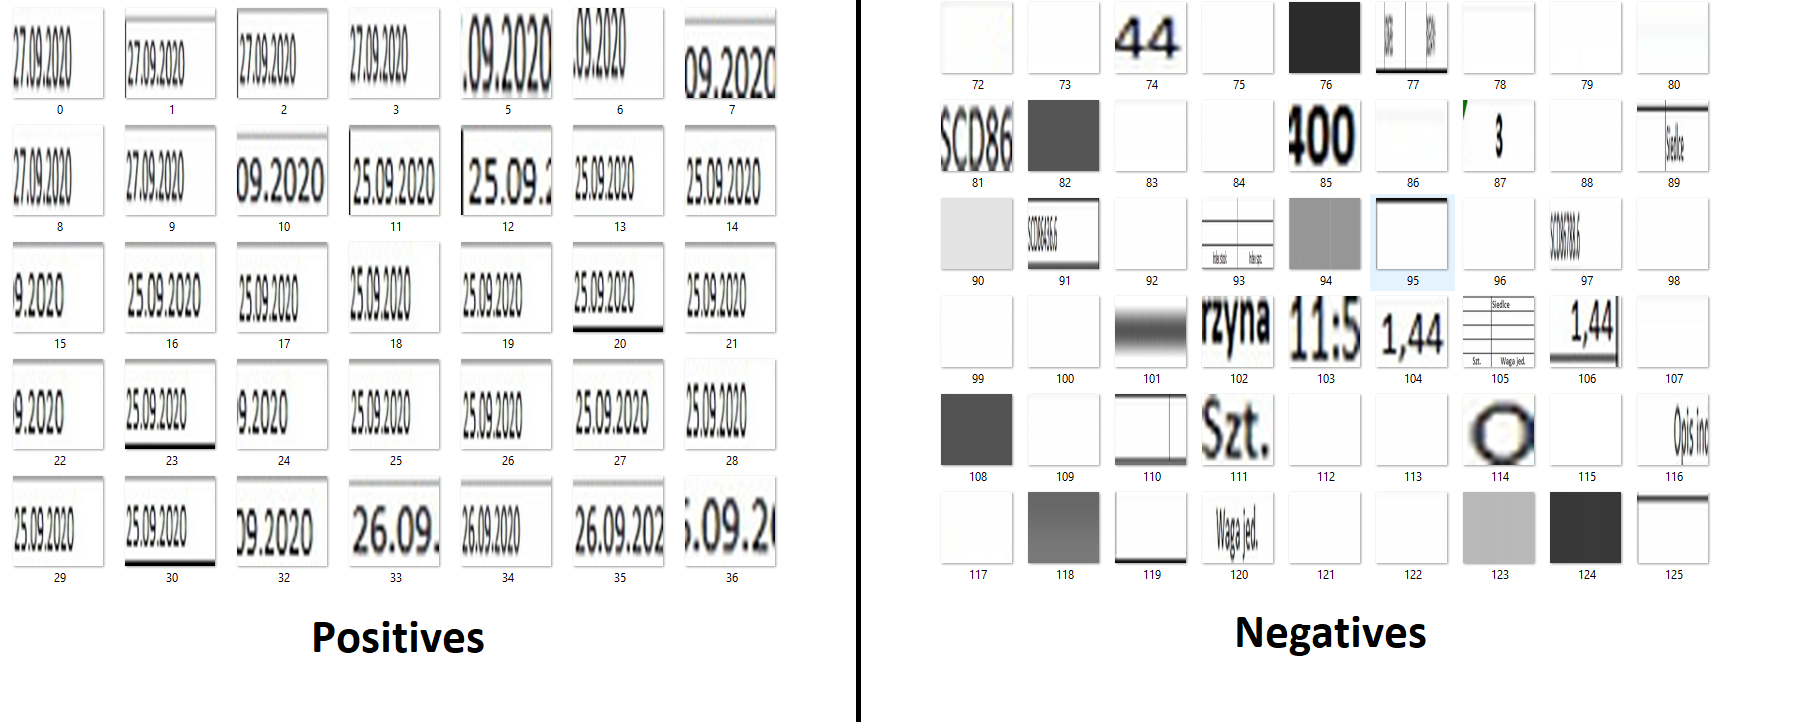
As You can see, the positive samples present a variety of dates, while the negative other image elements. On such a dataset, we can move on to building the R-CNN neural network model. A helpful library in this aspect will be the previously mentioned Tensoflow with Keras.
After loading samples of the created model architecture You should split into test and training data. We can quickly do this with a single line of code using scikit-learn, when we can define the size of the test data (test_size) and the shuffle value (random_state).
(self.train_x, self.test_x, self.train_y, self.test_y) = train_test_split(self.data, self.labels,
                                                                                  test_size=0.1,
                                                                                  stratify=self.labels,
                                                                                  random_state=42)
The Tensorflow library is already so extensive that it provides us with ready-made network architectures. The implemented algorithm uses the MobileNetV2 model, containing pre-trained weights from ImageNet. Here we define the dimension of each tensor, i.e. in this case the image, which is the input of the model.
self.model = MobileNetV2(weights="imagenet", include_top=False, input_tensor=Input(shape=(224, 224, 3)))
To the ready model architecture, optionally we can add layers to improve the network. In this use case have been used:
- pooling – combining the spatial data created by the convolution layer, minimizing the input data in both dimensions,
- flatten – minimazing each tensor to one dimensional,
- dense – enabling the connection of nodes in each subsequent layer using the activation function,
- droput – consisting in a random data rejection. Allows for regularization to prevent overfitting. It also proved the flexibility of the neural network and the margin of response to input data.
The next step in creating Your own R-CNN based detector is to compile the model with defined optimizer, metrics and loss function.
self.model.compile(loss="binary_crossentropy", optimizer=Adam(lr=self.lr), metrics=["accuracy"])
This algorithm uses the Adam’s optimizer, the acurracy metric and the loss function binary crossentropy. The selected parameters are popular for similar use cases, but in the detailed Tensorflow documentation you can find something specific for Your solution.
Now we can proceed to the training process. By properly defining the parameters of a function, we can do it with a line of code:
self.model.fit(
    x=None, y=None, batch_size=None, epochs=1, verbose=1, callbacks=None,
    validation_split=0.0, validation_data=None, shuffle=True, class_weight=None,
    sample_weight=None, initial_epoch=0, steps_per_epoch=None,
    validation_steps=None, validation_batch_size=None, validation_freq=1,
    max_queue_size=10, workers=1, use_multiprocessing=False
)
Remember to choose the right learning parameters. Each epoch is modified with indivudal weights, which affects the quality of the network. In the algorithm results section of this article, You can see the parameters we selected and information on how to modify them.
After completing the network training process, it is enough to save the model to a file and proceed to the next stage, i.e. object detection on test data. Now, for each input image, we once again perform a selective search segmentation and use the built-in model to predict individual ROI’s. For our own solution, we can define a minimum probability for which the regions will be considered valid. Typically, this value is in the range of 95-99%. Finally, all ROI’s that were filtered out in the previous operations can be marked on the target image by using simple function of the OpenCV library. The next chapter presents the effects of the R-CNN based detector constructed in this article.
Results and summary
To implement detecor in this article were used only 10 images. It allowed to generate about 150 positive and 1000 negative samples. An important aspect of the network training itself is the selection of parameters. These include learning rate, batch size and number of epochs. The Tensorflow library provides tools for evaluating the solution, such as Tensorboard or the classification report. In the first one, we can observe different types of graphs, such as the accuracy and loss of the learning process every epoch. Additionally, the report automatically predicts the test data, returning the final precision. Thanks to this, even if we select parameters experimentally, we can deduce their further modification in order to improve the network.
The created dataset and selected parameters (learning rate = 0.00001, batch size = 32, epochs = 100) allowed to obtain the final accuracy – 97%. Considering that the image’s collection was relatively small, good results were achieved. At the end of this article, let’s show the effects of the implemented date detector on sample images of transport documents.
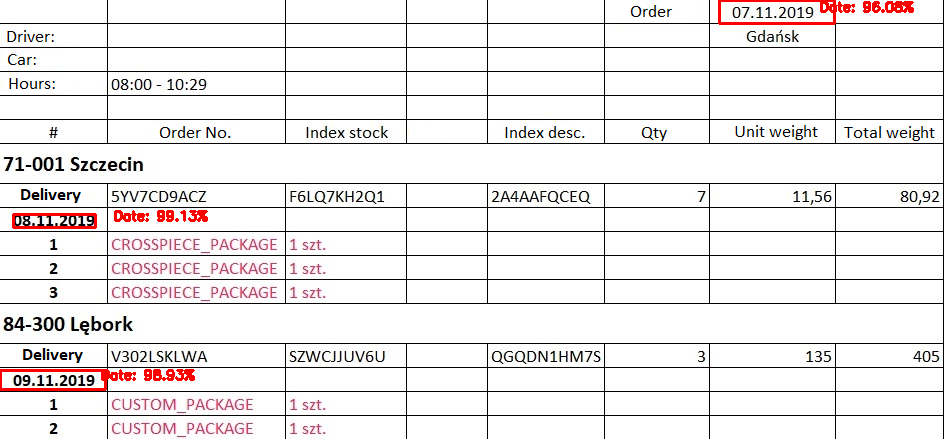
You can see in the pictures that the detecor is doing very effectively. If we would like to expand the developed detector, we would have to:
- prepare an extensive set of data, various date cases and their location on the document,
- train the neural network again,
- depending on the metrics used, modify the parameters of the learning process,
- perform a detection on test images.
By following a few steps outlined in this article, You can create Your own solution by classifying a variety of objects. You can even upgrade your detector by adding more recognition classes.
Inero Software provides knowledge and expertise on how to successfully use cutting edge technologies and data to shape corporate digital products of the future.
In the blog post section you will find other articles about IT systems and more!